Cost Is Not Carbon: Why Cheap Systems Can Emit More
The assumption that cost-optimized infrastructure is automatically carbon-efficient is dangerously wrong. Discover why cheap cloud resources can emit more carbon and how to optimize for what actually matters.

- Dr. Vivek Shilimkar
- 12 min read
This article is for teams that have recently started implementing green cloud and are new to it. Optimizing for cost and optimizing for carbon are not the same thing. In many cases, they directly oppose each other.
While implementing green cloud systems teams chase cheaper cloud regions, older instance types, and maximum discount utilization—all while assuming they’re reducing environmental impact. The assumption is rarely questioned because cost is visible, measurable, and tied to quarterly reviews. Carbon emissions are invisible, estimated, and rarely tracked.
The result: infrastructure decisions that reduce cloud bills by 20-30% while increasing carbon emissions by similar or larger margins. The problem isn’t malicious intent. It’s that we optimize for what we measure, and we don’t measure carbon.
The Dangerous Assumption
I think there is a widely held belief in software engineering circles that if you’re reducing cloud costs, you must also be reducing environmental impact. The logic seems sound on the surface:
- Less money spent = fewer resources used
- Fewer resources = less energy consumed
- Less energy = lower carbon emissions
Except that’s not how it always works in practice.
This assumption may lead teams to make decisions that increase their carbon footprint by 30-40% while celebrating cost reductions.
Why Cheap Can Mean Dirty
Let me walk through the ways that cost optimization can actually increase carbon emissions.
1. Region Shopping Based on Price
Cloud providers have different prices in different regions. It’s tempting to move workloads to cheaper regions to reduce bills. But regions have vastly different carbon intensities in their electricity grids.
Ohio (us-east-2) region is about 22% cheaper than Ireland (eu-west-1). Why? Because:
- Ireland’s grid is approximately 40% renewable
- Ohio’s grid is approximately 85% fossil fuels (mostly coal and natural gas)
The carbon emissions per computation roughly doubled, even though the cost decreased. The cheaper region was powered by dirtier energy sources.
Now, AWS will tell you both regions are “100% renewable” through their purchase of Renewable Energy Certificates. But the physical grid powering those data centers hasn’t changed—the location-based carbon intensity remains vastly different.
2. Older Generation Instances
Older compute instances are often cheaper because they’re being phased out. But they’re also less energy-efficient. A five-year-old processor might consume 40-60% more power to do the same work as a modern one.
Teams might choose older instance types (t2 instead of t3, or older GPU generations) to save money. The cost savings are real - maybe 15-20% - but the energy consumption increases significantly. You’re paying less per hour, but you’re using more electricity per task completed.
3. Over-provisioning to Capture Discounts
Reserved instances and savings plans offer significant discounts - sometimes 50-70% off on-demand pricing. The catch is you pay upfront for capacity whether you use it or not.
This creates an incentive to over-provision. Teams reserve more capacity than they need to maximize “value.” The result? Resources running idle, consuming power and emitting carbon, just because they were financially committed.
It is normal to have a 40% of the reserved capacity sitting idle during off-peak hours. From a cost perspective, they were already paid for, so there was no financial incentive to shut them down. From a carbon perspective, they were burning electricity for nothing.
4. Spot Instances Without Efficiency Gains
Spot instances can be 70-90% cheaper than on-demand. They’re great for cost optimization and can be great for carbon optimization too - when used correctly.
But here’s what often happens: teams use spot instances without changing their architectures. They run the same workloads, just on cheaper compute. If the underlying workloads are inefficient - poorly optimized code, unnecessary processing, data fetched repeatedly - you’re still wasting energy, you’re just paying less for it.
The carbon emissions per useful work done doesn’t improve just because the invoice is smaller.
5. The Utilization Trap
Here’s a counterintuitive one: sometimes the most cost-effective choice is the least carbon-efficient.
Consider two scenarios for running batch jobs:
- Option A: Use a powerful, modern instance that completes the job in 1 hour at $5
- Option B: Use a cheaper, older instance that completes the same job in 2.5 hours at $4
From a cost perspective, Option B wins. But from a carbon perspective:
- Option A uses modern, efficient processors running for less time
- Option B uses older, less efficient processors running much longer
Even though you’re paying less, the total energy consumed - and carbon emitted - can be higher in Option B.
What Actually Matters: Carbon Intensity
If cost isn’t a good proxy for carbon, what should we measure?
The answer is carbon intensity - the grams of CO₂ emitted per unit of computing work done. This depends on:
- Grid Carbon Intensity: Where is the electricity coming from? Renewable energy, nuclear, natural gas, coal?
- Hardware Efficiency: How efficient is the processor? Newer architectures do more work per watt.
- Utilization: Are you running resources at high utilization or leaving them idle?
- Workload Efficiency: How much unnecessary work is your code doing?
These factors don’t always align with cost.
Putting Numbers to It
To make this less abstract, consider what a typical ML training job looks like across three different cloud regions:
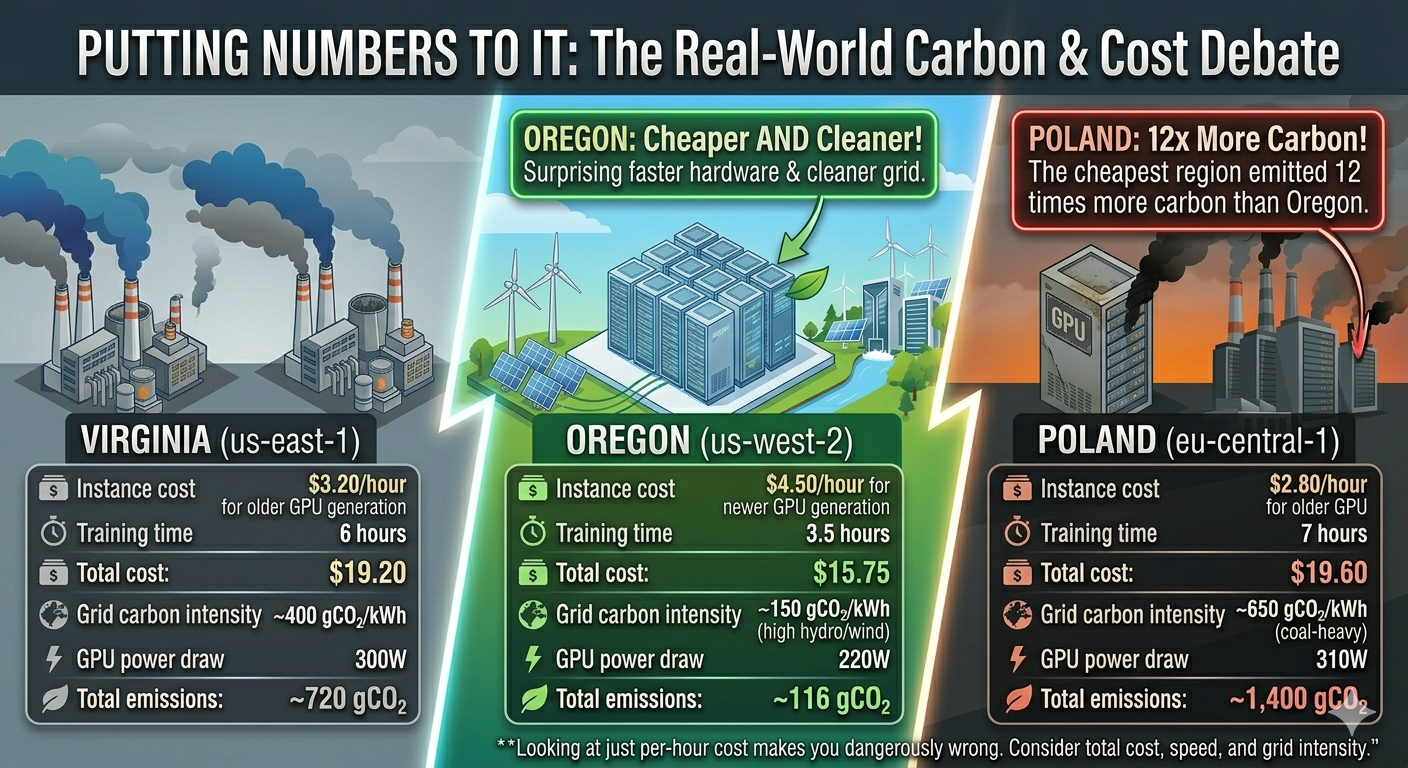
Virginia (us-east-1) — Cheaper
- Instance cost: $3.20/hour for older GPU generation
- Training time: 6 hours
- Total cost: $19.20
- Grid carbon intensity: ~400 gCO₂/kWh
- GPU power draw: 300W
- Total emissions: ~720 gCO₂
Oregon (us-west-2) — More Expensive
- Instance cost: $4.50/hour for newer GPU generation
- Training time: 3.5 hours
- Total cost: $15.75
- Grid carbon intensity: ~150 gCO₂/kWh (high hydro/wind)
- GPU power draw: 220W
- Total emissions: ~116 gCO₂
Surprisingly, Oregon was both cheaper AND cleaner due to faster, more efficient hardware and a cleaner grid. But if they had only looked at the per-hour instance cost, Virginia would have seemed like the better choice.
Now consider a third option:
Poland (eu-central-1) — Cheapest
- Instance cost: $2.80/hour for older GPU
- Training time: 7 hours
- Total cost: $19.60
- Grid carbon intensity: ~650 gCO₂/kWh (coal-heavy)
- GPU power draw: 310W
- Total emissions: ~1,400 gCO₂
The cheapest region emitted 12x more carbon than the Oregon region.
How to Actually Optimize for Carbon
If you want to reduce carbon emissions, not just costs, here’s what to focus on:
1. Choose Low-Carbon Regions
Look up the carbon intensity of cloud regions. Major cloud providers publish this data:
- AWS has sustainability dashboards
- Google Cloud has carbon footprint reporting
- Azure publishes emissions data per region - read more here
Prioritize regions with clean energy grids:
- Nordic countries (hydro, wind, nuclear)
- Quebec, Canada (hydro)
- Oregon, US (hydro, wind)
- Some parts of Europe (wind, solar, nuclear mix)
Avoid regions heavily dependent on coal:
- Some US Midwest regions
- Parts of Eastern Europe
- Some Asian regions
2. Use Modern, Efficient Instance Types
Newer processor generations (Graviton3, Intel Ice Lake, AMD Milan) are significantly more energy-efficient. The slight price premium is often offset by:
- Faster execution times
- Lower energy consumption
- Better performance per watt
Choose ARM-based instances (Graviton2/3) when possible - they often provide the same performance at 60% of the power consumption.
3. Actually Measure Utilization
Carbon efficiency requires high utilization, not just running resources. Idle CPU cycles still consume about 60% of peak power.
- Implement proper autoscaling
- Shut down non-production environments when not in use
- Use serverless for sporadic workloads
- Batch jobs to maximize utilization windows
4. Optimize the Workload Itself
The most carbon-efficient compute is the compute you don’t need to do:
- Profile and optimize code inefficiencies
- Cache results to avoid repeated calculations
- Use efficient data formats and compression
- Question whether every computation is necessary
A 20% improvement in code efficiency reduces both cost and carbon by 20%, no matter where it runs.
5. Time-Shift Where Possible
Grid carbon intensity varies by time of day. Solar peaks at midday, wind is often strongest at night. Some regions publish real-time carbon intensity data.
For batch jobs and non-urgent workloads, schedule them when grid carbon is lowest. This can reduce emissions by 20-40% at no additional cost.
6. Track Carbon as a Metric
What gets measured gets managed. Add carbon tracking to your dashboards:
- Estimated kWh consumed per service
- Carbon per deployment or per API call
- Regional carbon intensity trends
- Progress toward reduction targets
If you’re running Kubernetes, there are open-source tools specifically built for tracking energy and carbon at the pod and container level:
- Kepler (Kubernetes-based Efficient Power Level Exporter) — A CNCF project that uses eBPF probes to measure real-time energy consumption per pod, container, and namespace. It exports Prometheus metrics, so it plugs directly into your existing Grafana dashboards. This is probably the most mature option for Kubernetes-native carbon visibility.
- Kube-green — A Kubernetes operator that automatically shuts down non-production pods during off-hours (nights, weekends). It doesn’t measure carbon directly, but it eliminates idle workload emissions that teams forget about. Simple to deploy and effective for dev/staging clusters.
- Cloud Carbon Footprint — An open-source tool by Thoughtworks that estimates carbon emissions from cloud usage across AWS, GCP, and Azure. It works at the billing/API level rather than the Kubernetes level, but pairs well with Kepler for a full picture—Kepler gives you pod-level granularity, CCF gives you the broader cloud account view.
- Carbon Aware KEDA Scaler — Extends KEDA (Kubernetes Event-Driven Autoscaling) to factor in real-time grid carbon intensity when scaling workloads. It can delay or shift batch jobs to times when the grid is cleaner, automating the time-shifting strategy mentioned above.
These tools are not just nice-to-have. Without them, carbon optimization in Kubernetes is guesswork. You can’t optimize what you can’t see, and most teams have zero visibility into the energy their pods actually consume.
Make carbon visible the same way you make cost visible.
“But AWS Says It’s 100% Renewable!”
At this point, someone on your team will raise a fair objection: cloud providers claim their regions run on renewable energy, so does region choice even matter?
AWS, for example, states that it aims to power operations with 100% renewable energy by 2025—five years ahead of its original 2030 target. As of 2023, AWS reported that 22 regions were attributable to 100% renewable energy, including high-traffic regions like US East (Virginia), US West (Oregon), Europe (Ireland), Europe (Frankfurt), Asia-Pacific (Mumbai), and others across North America, Europe, and Asia-Pacific.
This sounds like the carbon question is solved. It isn’t. Here’s why.
Market-Based vs. Location-Based Accounting
AWS achieves its renewable energy claims through market-based accounting. This means they contract for renewable power from utility-scale wind and solar projects, and purchase environmental attributes like Renewable Energy Certificates (RECs) and Guarantees of Origin. These are financial instruments. They don’t change the physical electrons flowing into the data center.
A data center in Virginia still draws power from the PJM grid, which is heavily reliant on natural gas and coal. AWS buying a REC from a wind farm in Texas doesn’t change what actually powers the servers in Virginia at 2 AM on a Tuesday. It means that somewhere, an equivalent amount of renewable energy was generated—but not necessarily at the same time or place.
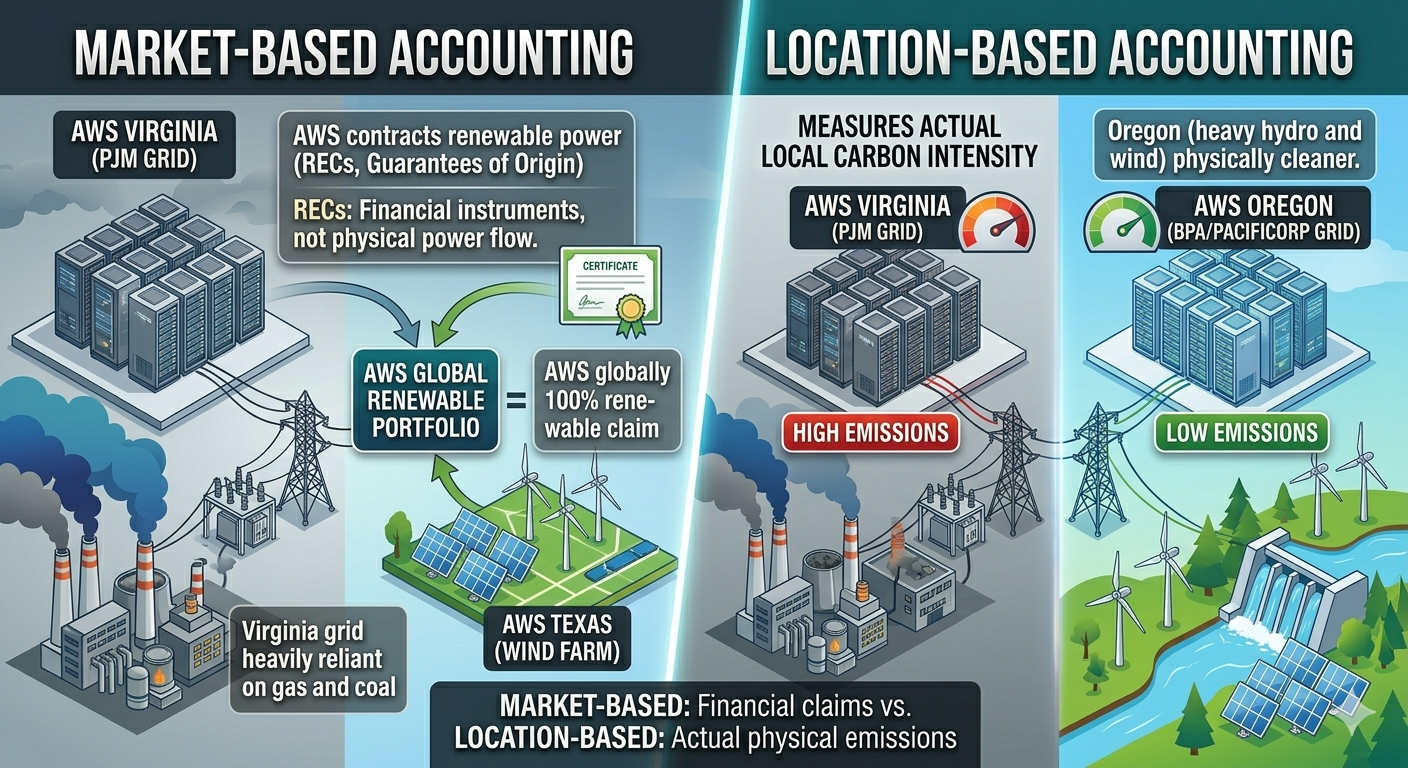
Under location-based accounting—which measures the actual carbon intensity of the local grid—Virginia and Oregon still have vastly different emissions profiles. The grid in Oregon (heavy hydro and wind) is physically cleaner than the grid in Virginia (natural gas dominant), regardless of what RECs AWS holds.
Why This Matters for Your Decisions
If your organization reports emissions using location-based methods (as many do for Scope 3 reporting), the region you choose still directly impacts your reported carbon footprint. Even under market-based methods, there’s a meaningful difference between:
- Running workloads where the grid is already clean (additionality is less needed)
- Running workloads on a dirty grid and offsetting with certificates from elsewhere
The first approach reduces actual atmospheric emissions. The second is an accounting mechanism.
This isn’t to dismiss what AWS and other providers are doing—investment in renewable energy projects is genuinely valuable and drives the energy transition forward. But treating all regions as carbon-equivalent because of market-based claims can lead to the same complacency this article warns against.
The practical takeaway: even with cloud provider renewable energy commitments, prefer regions with cleaner local grids when you have a choice. It’s the difference between actual decarbonization and paper decarbonization.
The Uncomfortable Trade-offs
Sometimes optimizing for carbon does cost more money. A cleaner region might be 15% pricier. A newer instance type might not qualify for existing reserved capacity. This creates real tensions between sustainability goals and financial constraints.
I don’t have a magic answer for this. Different organizations will make different choices based on their values and constraints. But I think the first step is knowing the trade-off exists and making it explicitly rather than assuming cost optimization is good enough.
If your company has sustainability goals or carbon reduction targets, those need to be translated into engineering metrics and budget allocations. You can’t achieve carbon reduction as a side effect of cost optimization - they require intentional, sometimes expensive, trade-offs.
What This Means Practically
If you’re an engineer or architect making infrastructure decisions:
- Don’t assume cheaper means greener
- Check region carbon intensity before moving workloads
- Consider total runtime and energy efficiency, not just hourly cost
- Measure actual utilization, not just reserved capacity
- Optimize workloads for efficiency, not just throughput
If you’re in leadership:
- Add carbon metrics to infrastructure dashboards
- Include emissions in cost/benefit analyses for major infrastructure changes
- Consider allocating budget for carbon reduction even when it increases costs
- Don’t celebrate cost reductions without checking environmental impact
The Bottom Line
Cost and carbon are related, but they’re not the same thing. Assuming they are leads to decisions that save money while increasing environmental impact.
The cloud industry has made great progress on cost visibility and optimization. We have sophisticated tools for tracking spend, forecasting costs, and optimizing bills. We need the same level of sophistication for carbon.
Until carbon emissions are as visible and as tracked as cloud costs, teams will continue to optimize for what they can see. And what we can’t see, we often make worse while thinking we’re making it better.
So next time someone celebrates moving to cheaper instances or regions, ask the question: “But what happened to our carbon footprint?”
The answer might be uncomfortable. But it’s a question worth asking.
In the next article we will see “Why Carbon-Aware Systems Can Cost More and Still Be the Right Choice”
Note: The numbers in this article are illustrative examples based on typical scenarios. Actual carbon intensities vary by region, time of day, and grid composition. For precise calculations for your infrastructure, use cloud provider carbon reporting tools and regional grid data.