What Energy-Aware Tools Are Actually For (And What They Are Not)
Energy-aware tools make invisible consumption visible, but a dashboard reduces nothing. Here's what measurement tooling in Kubernetes is actually for — and what it can never do.

- Dr. Vivek Shilimkar
- 8 min read
Part 6 of 6 · Green Cloud Systems series
On this page
Every time I write about the energy cost of always-on infrastructure, the response lands in the same place: “Okay, so which tool should we install?”
It’s a fair question. It’s also, quietly, the wrong first question — and the reason I want to write this article before writing about any specific tool. Because in my experience, the moment a team installs an energy dashboard, one of two things happens. Either the dashboard becomes the project — something to point at in a sustainability review — or it becomes a scoreboard nobody trusts. Both outcomes waste the tool and change nothing about the underlying system.
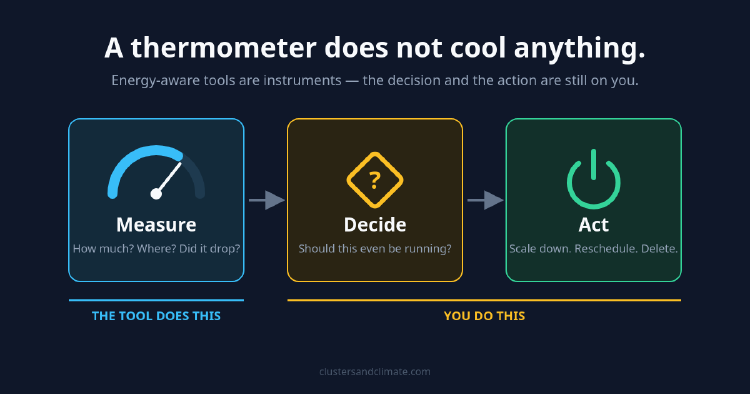
In climate science, we live surrounded by AWS — and no, not Amazon Web Services. In our world, AWS means Automatic Weather Stations. Add satellites, tide gauges, ice cores, and tree rings, and you get a discipline built almost entirely on instruments. And here is something every climate scientist learns early: a thermometer does not cool anything. The instrument answers a question. The decision — and the action — is still entirely on you. Energy-aware tooling in Kubernetes is exactly the same kind of thing. It is an instrument. Treating it as a solution is the most common failure mode of green cloud efforts I have seen.
So before we talk about Kepler, Scaphandre, Cloud Carbon Footprint, or any specific tooling — that is the next article — let’s be precise about the job these tools do, and the jobs they cannot.
What Energy-Aware Tools Are Actually For
1. Making the invisible visible
Energy has a visibility problem that cost does not. Your cloud bill arrives monthly, itemized, impossible to ignore. Nobody gets an energy bill per pod. A dev cluster idling at 2 AM draws power silently — no invoice line, no alert, no incident. This is the entire premise of the earlier article on always-on environments: the waste is invisible, so it is unquestioned.
Tools like Kepler exist to close that gap. They attach numbers to something your infrastructure currently hides. That is their core value, and it is not small. You cannot have an honest conversation about energy use in a system where nobody can see it.
2. Establishing a baseline
Before you can change anything, you first need to measure what it currently consumes — not a rough estimate, but a number precise enough to compare against later. Every serious emissions study in climate science starts the same way: with a baseline period you can defend. Without one, every future claim is unfalsifiable. Did moving that batch workload to a cleaner window help? Did shutting down environments overnight matter? With no baseline, the honest answer is we don’t know — and “we don’t know” is where green initiatives go to die.
3. Attribution — knowing where the energy goes
A cluster’s total power draw is one number. It tells you almost nothing useful. What matters is attribution: which namespace, which workload, which team, which cron job is responsible for the consumption. Modern energy-aware tools use eBPF and hardware counters (RAPL on Intel, equivalents elsewhere) to estimate per-process and per-pod energy use. This is what turns “the cluster uses a lot of energy” into “this three-replica staging deployment that nobody has touched in two months is responsible for a fifth of it.” Only one of those sentences is actionable.
4. Verification — did the change actually work?
This is the use case nobody talks about and the one I care about most. You made a change. You scaled something down, rescheduled something, rightsized a node pool. Did energy use actually drop — or did it just move? Did the cron job you shifted to a low-carbon window actually run there? Measurement tools close the loop between intent and outcome. Without them, you are shipping sustainability changes with no tests.
5. Building feedback loops for engineers
Engineers already watch cost and latency because those numbers sit right in front of them on a dashboard. Put energy in the same place, and it starts to shape decisions the same way — not because anyone is told to care, but because it is now something they can actually see. That, more than the numbers themselves, is the real value of this tooling: energy stops being an afterthought and becomes just another signal engineers check by habit.
What Energy-Aware Tools Are Not
Now the harder half. Every item on this list is a real misuse I have watched happen.
1. They are not a reduction mechanism
A dashboard reduces nothing. Zero watts. This sounds obvious, yet “we installed an energy monitoring tool” gets reported as progress in sustainability reviews constantly. The tool is the start of the work, not the work. If your green cloud initiative ends at instrumentation, you have built a very accurate record of your unchanged emissions.
2. They are not truth-meters
This is the climate scientist in me talking, and it matters: these tools produce estimates, not measurements in the strict sense. Kepler does not read a power meter per pod — it reads hardware counters and models how much of the machine’s energy belongs to which process. Shared resources — the kernel, the network, the memory bus, idle silicon — get attributed by assumptions, not by observation. Cloud provider carbon reports are the same: allocation models with baked-in assumptions about what counts as yours.
That does not make them useless. Climate science understanding runs on proxies like this all the time — tree rings are not thermometers either, but they still tell us something real. The same goes here: treat these numbers as directionally right, with a margin of error, not as audited fact. Use them to spot trends and find hot spots. Do not quote pod-level numbers to the watt-hour in a compliance document, and do not argue over whether a team used 4.2 or 4.7 kWh — that kind of precision simply is not there.
3. They are not a scoreboard for shaming teams
The fastest way to kill energy visibility is to use it punitively. The moment “your namespace has the highest energy use” becomes a blame instrument, teams will find reasons the data is wrong — and they will have a point, because the data is modeled. Energy numbers are a shared diagnostic, like a flame graph. The goal is finding waste together, not ranking teams by guilt. Green cloud imposed as moral pressure fails; I’ve argued this since the first article in this series, and tooling does not change it.
4. They are not a substitute for the design question
Here is the uncomfortable limit: a tool can tell you how much energy your dev cluster consumes. It cannot tell you whether that cluster should exist. It cannot tell you whether the workload belongs in a different region, whether the environment should run at night, or whether the test suite needs to run at all. Those are design and policy questions. Instruments inform them; they cannot answer them. If you roll out this tooling without also giving someone the authority to act on what it shows, you end up with a team that can see the problem but has no power to fix it.
5. They are not a prerequisite for acting on obvious waste
The mirror-image mistake of installing tools too eagerly is refusing to act until the tooling is perfect. You do not need eBPF-based per-pod attribution to know that a development cluster sitting at 2% utilization all weekend is waste. Some findings require instrumentation; a great many require only that someone look. Do not let “we’re still evaluating measurement tools” become the reason nothing changes this quarter. Act on what is already visible; let the tooling refine the rest.
The Dashboard Trap
There is a pattern worth naming explicitly, because it is the most common failure mode of all: measurement theater. The dashboard gets built, the graphs look impressive, they get shown in a quarterly review, and the infrastructure underneath continues exactly as before — now with better documentation of its own waste.
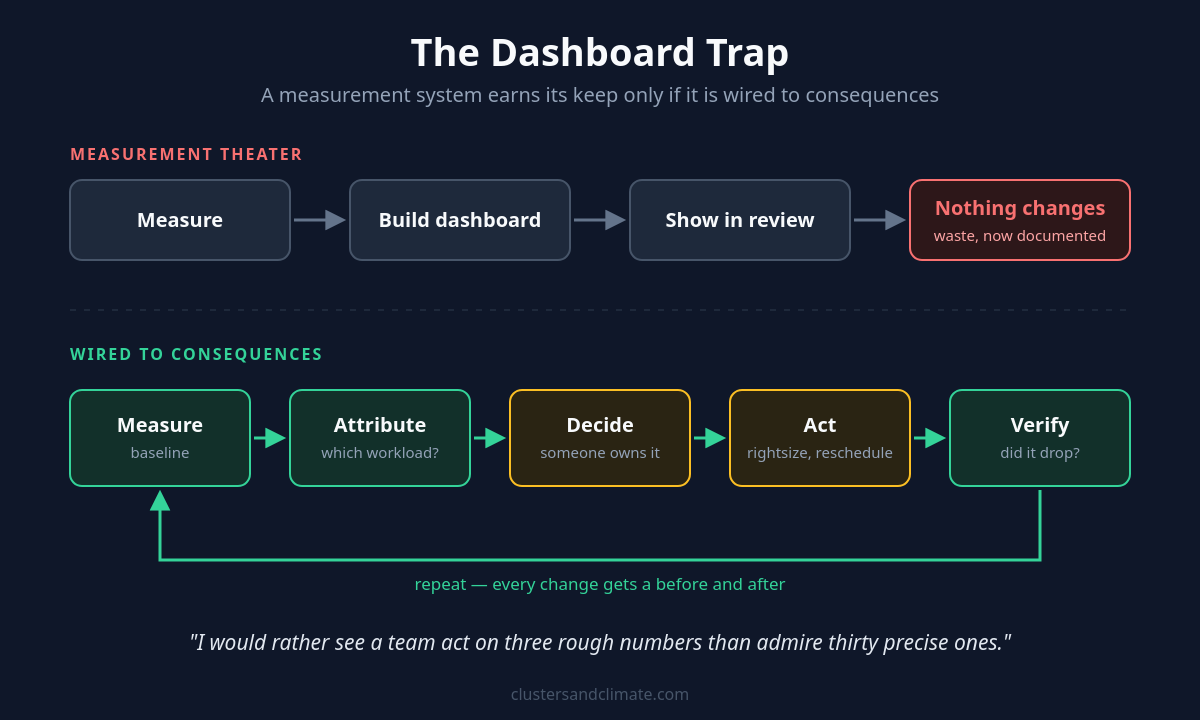
The tell is simple: if your energy dashboard exists but no alert, no report, and no decision ever comes out of it, it is decoration. A measurement system earns its keep only if it is wired to consequences — a rightsizing decision, a schedule change, an architecture review, a deprecation. I would rather see a team act on three rough numbers than admire thirty precise ones.
The Questions Worth Asking
A good way to hold all of this is to separate the questions these tools answer from the ones they cannot:
Tools answer: How much energy are we using? Where does it go? Is it trending up or down? Did that change help? Which workloads are outliers?
Tools cannot answer: Should this workload exist? Is this cluster provisioned sanely? What trade-off between cost, carbon, and latency is acceptable? Who should act on this?
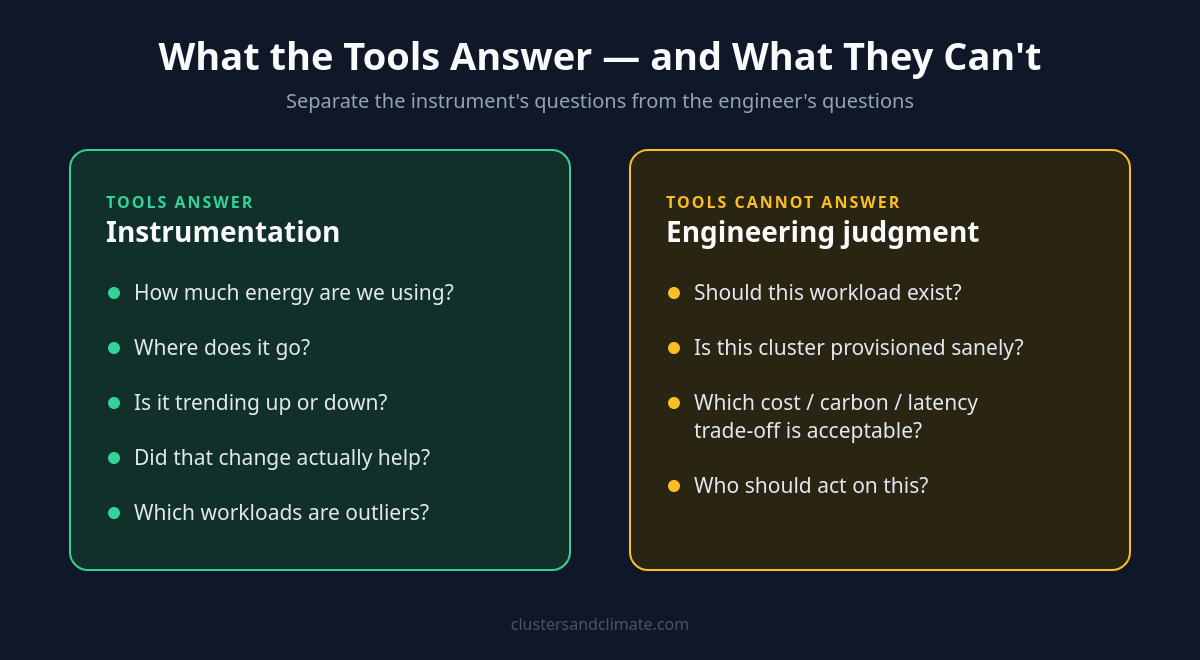
The first list is instrumentation. The second list is engineering judgment — and it is exactly why this series spent five articles on mental models before touching a single tool.
Where This Goes Next
Now that the frame is clear — instruments, not solutions; estimates with error bars, not verdicts; visibility in service of decisions, not decoration — we can talk about specific tools without falling into the traps above.
In the next article, I will go into Kepler and its neighbours properly: how eBPF-based energy attribution actually works under the hood, what the numbers it exports really represent, where the estimates are strong and where they are shaky, and how to wire it into Prometheus and Grafana in a way that produces decisions rather than dashboards.
The tools are genuinely good. They are just smaller than their reputations — and that is fine. An instrument does not need to be a solution to be worth installing. It just needs to make the invisible visible, honestly.
This article is part of a series on Green Cloud Systems. Earlier articles covered why green cloud matters, the hidden energy cost of always-on dev/test clusters, practical implementation strategies, why cost and carbon are different problems, and why carbon-aware choices can justify a premium. Next up: a deep dive into Kepler and workload-level energy measurement.